Friday Recap: 6/7/2024
June 7th.


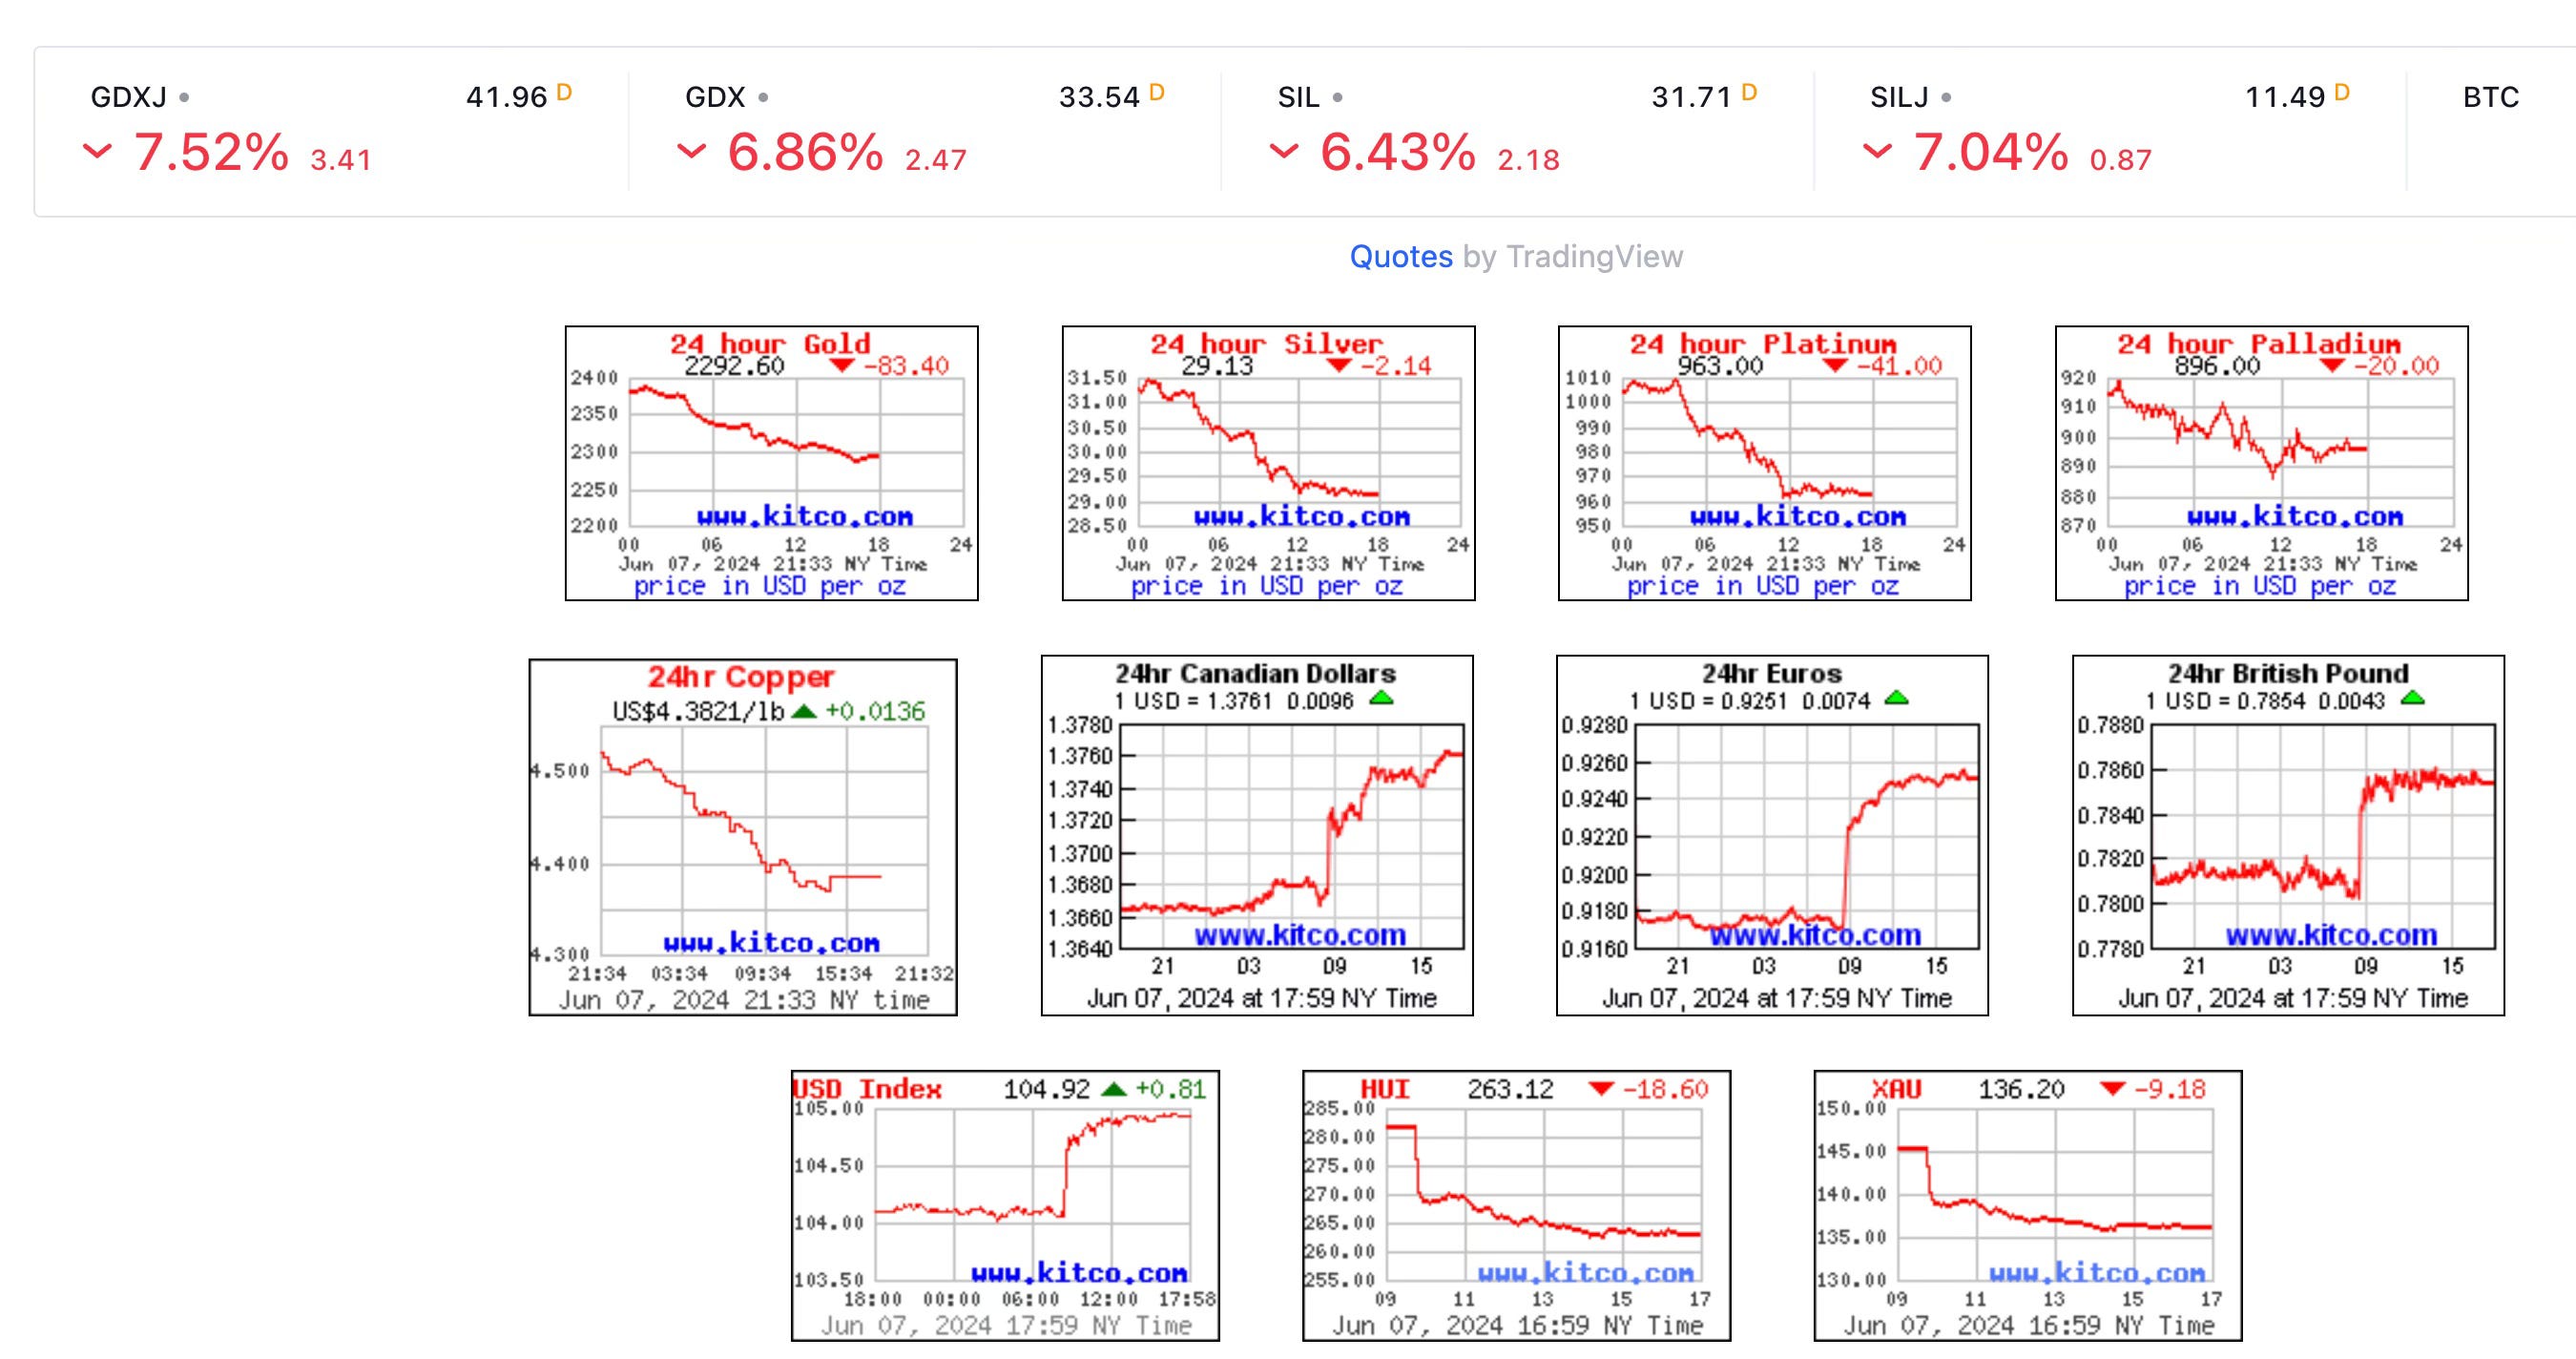
AU: $2292 ($2328 - Last Week Spot)
AG: $29.13 (30.34)
HUI: 263 (279)
DXY: 105 (104)
S&P: 5346 (5277)
10-Yr: 4.4% (4.5%)
Oil: $75 ($77)
The story this week continued to be stocks, with the S&P hitting an ATH. In fact, it opened today at an ATH. My thesis remains that a strong stock market prevents Wall Street from being interested in gold or gold miners. Gold has been over $2300 for more than two weeks, and the HUI hasn't broken out. The HUI closed at 263 today. That is only 13 points from being back to neutral (I consider 250 to be neutral). We need 275 to start getting excited, and then 300 for a potential breakout.
Today, gold got hammered (down about $80) after being strong all week (silver was down 7%, following gold). Wall Street basically said, I don't need no stinking gold (when stocks are at ATHs). The Friday close is always important, and gold/silver beatdowns on Friday are quite common. I've witnessed many. It doesn't matter where gold trades during the week, but where it closes on Friday (the same can be said of the HUI). A Friday close can confirm breakouts, invalidate them, or set the tone for the following week.
I don't expect to see gold above $2500 or silver above $35 until we see a fear trade on Wall Street. This is why Lil Sis took off her running shows at $32.50 silver. I expected her to run to $35, but it is now apparent why she stopped. We now have a bit of a pause until the party on Wall Street is over.
Right now, Wall Street keeps buying stonks, expecting the economy to have a soft landing (or no landing). I think that is a fantasy expectation, and the bad news will continue (such as 2600 stores have closed this year). The key level I'm waiting for is 4800 on the S&P (it gets interesting sub 5000). Below 4800, and I think the fear trade begins. That simply means those who are overweight stonks (almost all of Wall Street) will begin to pivot into less risky assets. That pivot is all gold needs.
The only numbers that matter right now are the S&P 500 (Wall Street thinks this is the economy), GDP, unemployment, the 10-Yr rate, and the DXY. Everything else is just noise.
Isn't it interesting that today's all-important BLS unemployment report was a total fabrication? And that the household survey was ignored (it always is)?
BLS: +272K (including +231K from the birth/death model). Note: the BLS counts new jobs and not workers (it can double count jobs for workers).
The Household Survey: -400K. It does not include the b/d model and only counts workers (it does not double count).
Full-time Jobs: May 2023: 134.4M vs May 2024 133.3. Loss of 1M jobs. All new jobs in May were PT, and mostly for people who already have a job. The participation rate dropped in May.
Green Line (BLS) vs Red Line (Household Survey)

Note: What happened in 2021? Hint: New Administration.
Charts