

Friday Recap (11/21/2025)

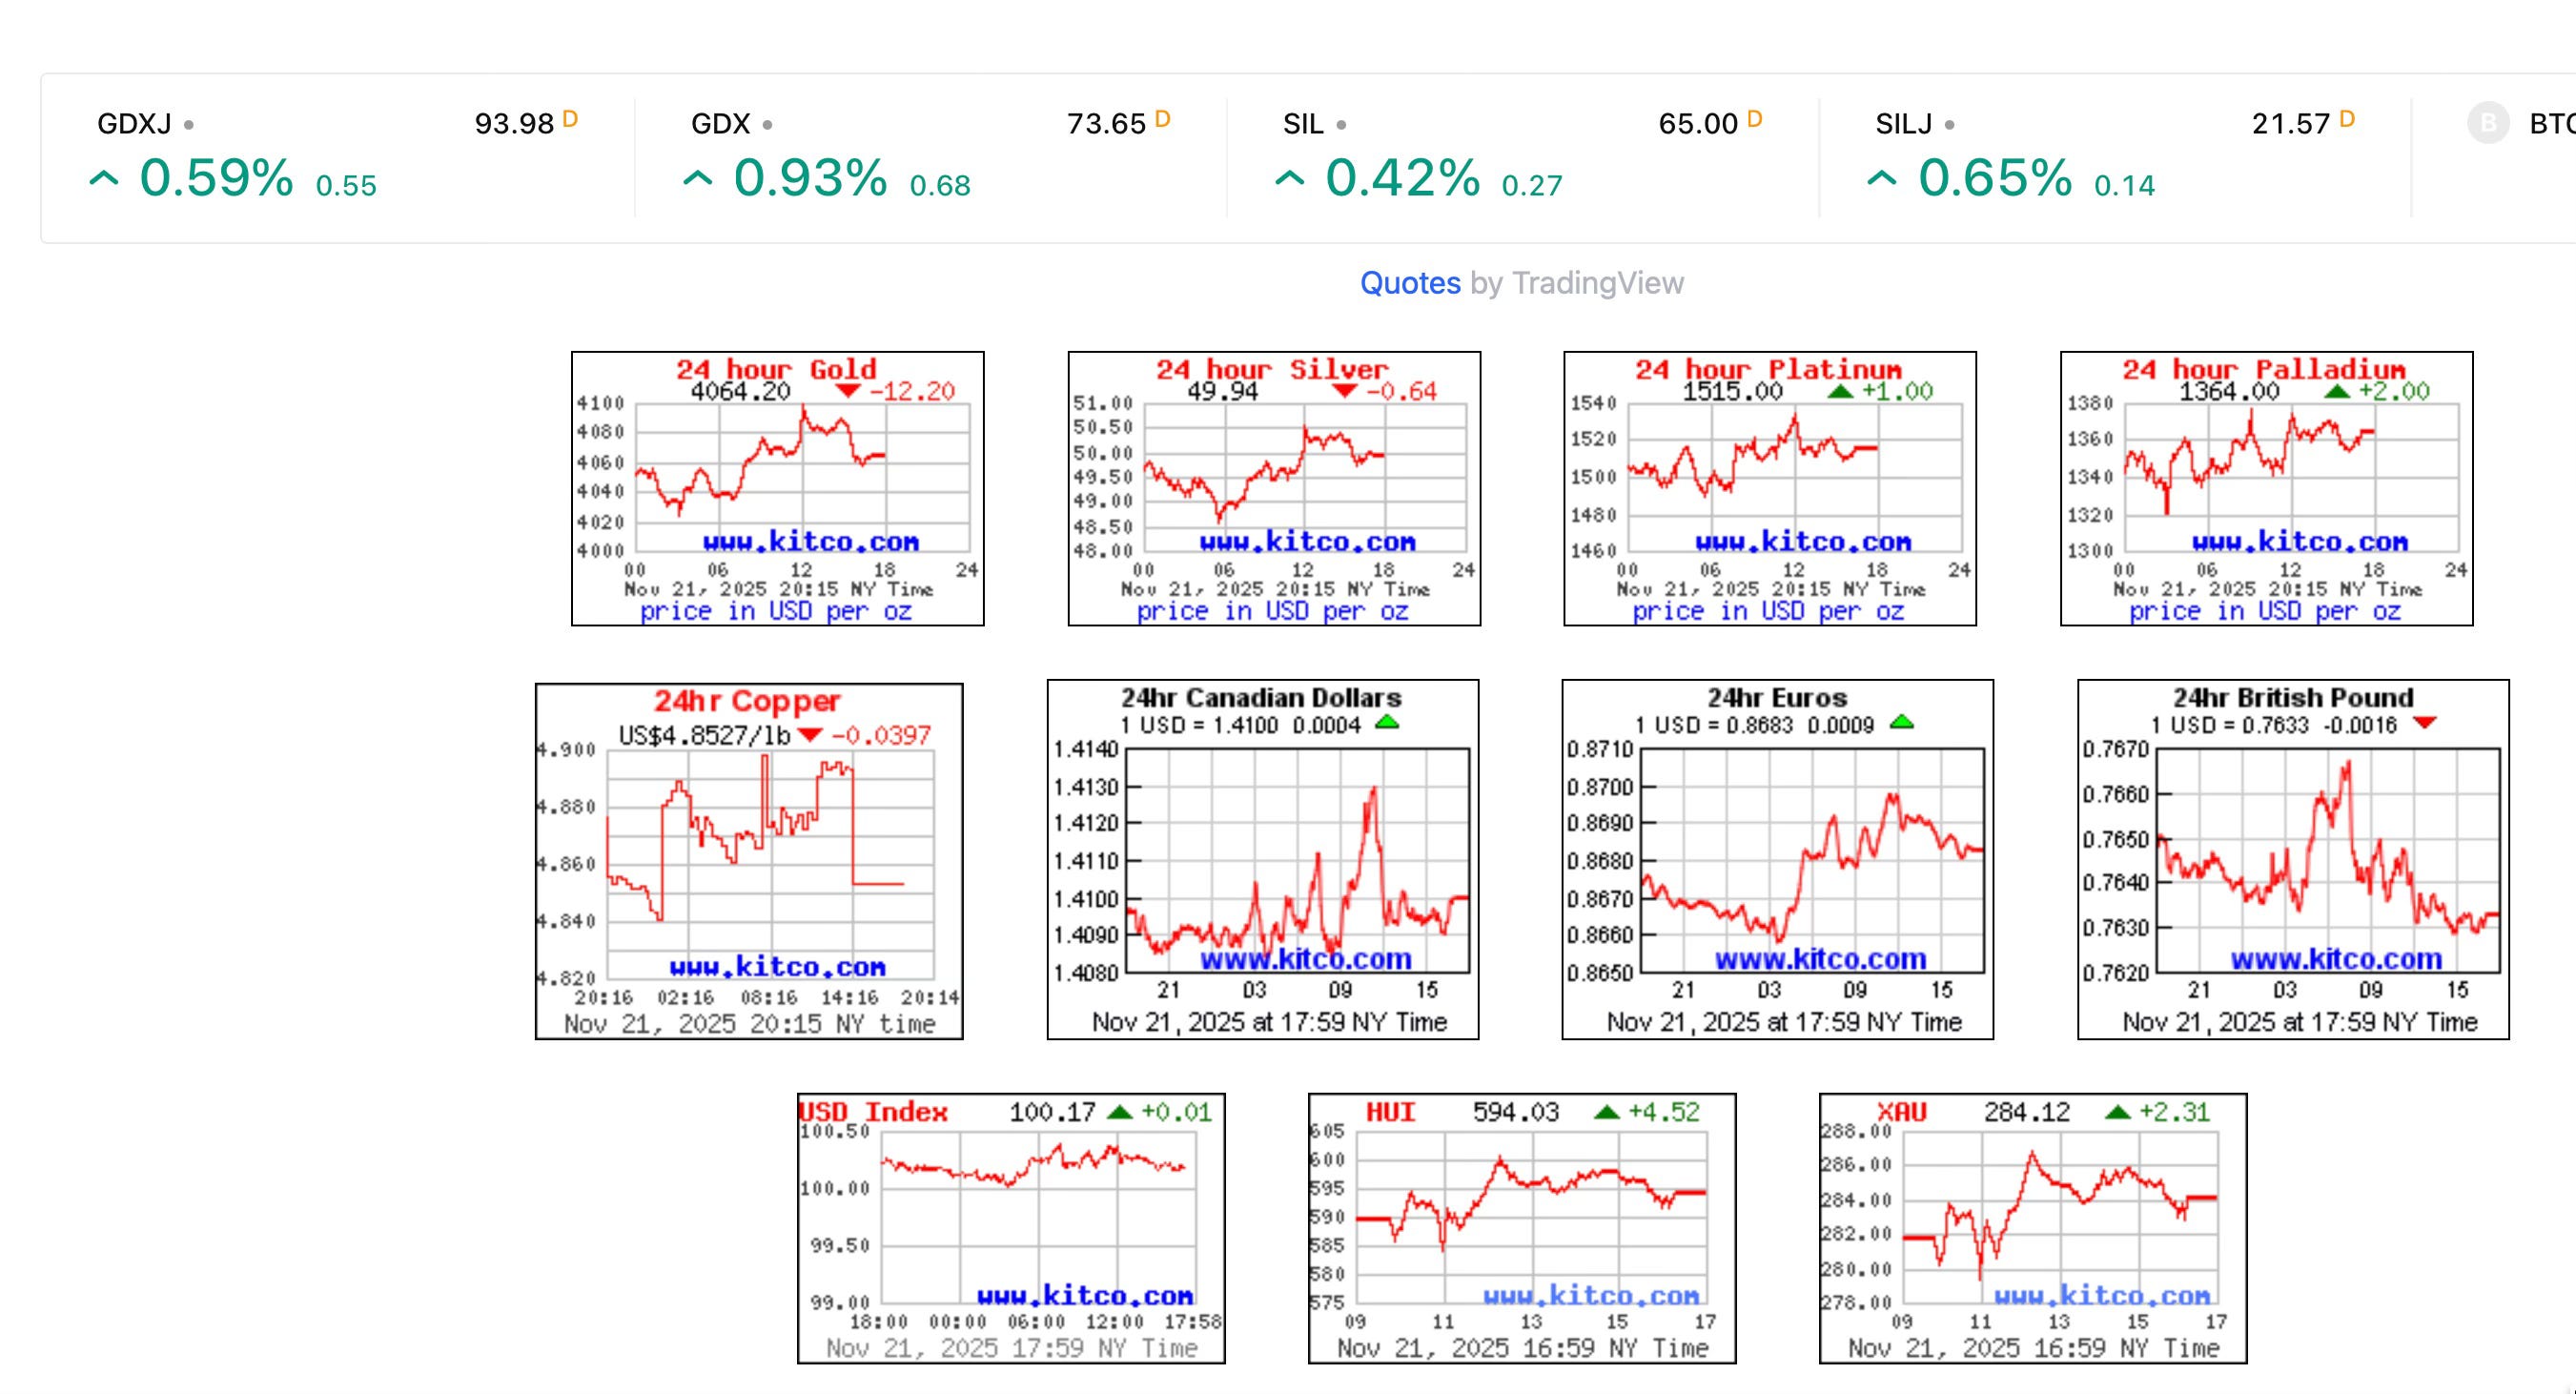
AU: $4055 ($4080 - Last Week) - - (Jan 1st $2623 = +54% YTD)
AG: $49.70 (50.47) - - (Jan 1st $28.97 = +71% YTD)
HUI: 594 (615) - - (Jan 1st 289 = +105% YTD)
DXY: 100.1 (99.2)
S&P: 6602 (6734) - - (Jan 1st 5881 = +9% YTD)
10-Yr: 4.06% (4.15%)
Oil: $57 (60)
We witnessed volatility this week on Wall Street after NVIDIA released its earnings. Initially, the S&P 500 opened strongly, only to reverse midday (on no news), and then closed down 1.5%. Everyone was asking what happened, and no one had answers. I think it was all about NVIDIA. After it opened big (running to 196), profit takers showed up, and it began to cascade downward (dropping to 172), pulling down the entire market. The issue here is NVIDIA’s size and if it can maintain its projected growth. My guess is no. NVIDIA is likely dead-man walking, and many current shareholders are likely to become bag holders.
If you look at NVIDIA’s chart, it looks ugly. If it can’t find a new high (207) soon, then 180 is likely to fail. Yesterday, it ripped to 196 on the open, crashed to 172, and then closed at 180, which is an important support level. If 180 doesn’t hold, then down to 150 we go. That’s likely to be when the S&P gets into trouble and has lost its market leader. As I have said, the only chart that matters at this time for gold is the S&P 500 (Gold is trapped until the S&P gets out of its way), and the most important chart in the S&P is NVIDIA.
Wall Street talking heads have been using two data points to support their bullish outlook to remain fully invested and overweight tech: 1) GDP, 2) Earnings. For GDP, if you strip out AI investments, you can easily cut GDP in half. So, half of GDP is only going to a tiny subset of the economy, which is misleading. Plus, GDP includes government spending, which is obtained via borrowing. That is also sketchy. If a company borrows money, it can’t call that revenue, but that is essentially what the government does. You should not be able to print (money) GDP. As for earnings, half of it comes from the MAG7. If you strip out the MAG7, which is a better reflection of the economy, earnings are currently at only 7% growth. And those are the top 500 companies. If you look at the Russell 2000, it gets uglier. So, S&P average earnings are not exactly the best data point to analyze this economy.
Wall Street (and Washington) wants you to believe (spinning their narrative) that the economy is strong. It’s not, and it’s getting weaker. The chance of a stock market crash and a recession keeps increasing. I think we have weeks or months before that outcome. My cycle low targets are $3500 to $3700 for gold, $42 to $43 for silver, and 500 to 525 for the HUI. Get ready. The good news is that once we get these cycle lows, we are likely heading to new ATHs for each, leaving the S&P 500 in the dust. My target for the S&P 500 is sub 4000 (reaching this bottom over the next 9-12 months). That means a 40%+ correction for the S&P 500. Ouch. This is going to get ugly. My recent article on Substack: It’s Over” outlined this outcome.
Just joined and don’t see any article titled, “It’s Over.” How to find? TY.